The Instrument Panel
A lightweight desktop hardware monitoring application built with Tauri 2, React 19, and Rust that displays real-time CPU, GPU, storage, and system metrics.
Why this project exists: I built this project to explore Tauri 2 desktop development and deepen my Rust systems programming skills. I wanted to create something practical that would require Windows API integration, binary data parsing, and real-time frontend updates. Hardware monitoring was a perfect fit — it combines low-level systems work with a polished UI, demonstrating the full stack from shared memory access to React components.
Focus: Cross-platform desktop development with Tauri 2 and Rust backend · Windows API integration for shared memory access · Real-time data polling and React state management · Systems programming with Rust for sensor data parsing
Highlights
- Real-time hardware monitoring with 1-second polling intervals
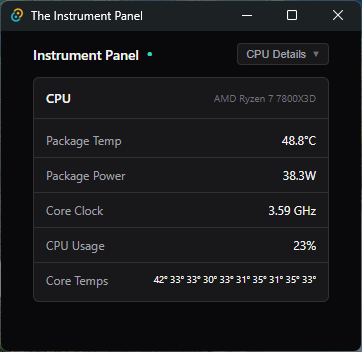
- CPU metrics including package temperature, power draw, clock speed, and per-core temperatures
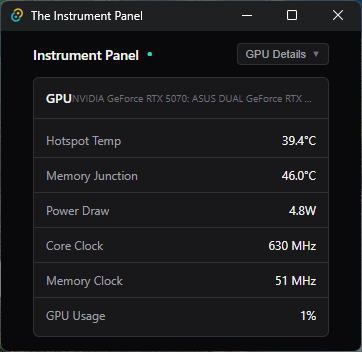
- GPU monitoring for hotspot temperature, memory junction, VRAM usage, and fan speed
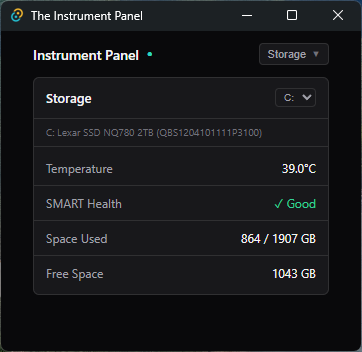
- S.M.A.R.T. health status and temperature monitoring for all storage drives
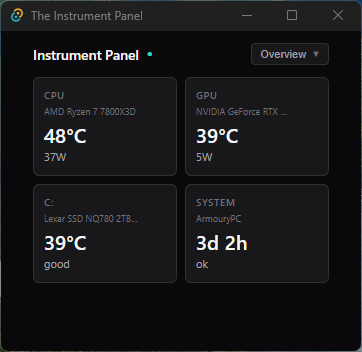
- Clean, minimal dark theme UI with card-based layout and warning indicators
- Tauri IPC bridge connecting Rust backend to React frontend
Notable challenges
- Integrating with HWiNFO's shared memory segment using Windows API calls in Rust
- Parsing binary sensor data structures and mapping readings to human-readable metrics
- Building efficient 1-second polling with React hooks while avoiding memory leaks
- Creating a hardware-agnostic sensor detection system using label pattern matching
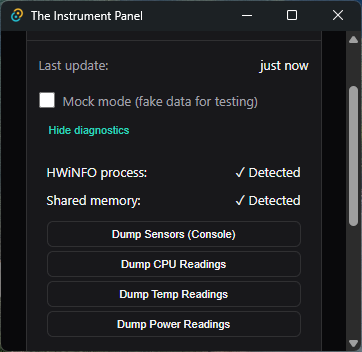
Screenshots
Click any image to view full size